How to Use Your SDR as a Scanner
Introduction
In an increasingly interconnected world, the radio frequency spectrum is densely populated with a wide range of transmissions, including broadcast radio, public safety communications, aviation traffic, satellite links, and various specialized or unidentified signals. To the untrained listener, this electromagnetic environment may appear as little more than noise or random static. However, with the appropriate tools and technical understanding, the spectrum reveals a highly structured and fascinating ecosystem of radio communications.
This guide explores how to convert a Software Defined Radio (SDR) receiver into an efficient frequency scanning platform using SDRSharp (SDR#) together with the Frequency Scanner Plugin. When integrated, these tools provide powerful scanning capabilities comparable to dedicated radio scanners, allowing users to automatically search, monitor, and log active signals across wide portions of the spectrum.
Whether you are an amateur radio operator interested in exploring new bands, a hobbyist monitoring aviation or public safety channels, or an experienced radio enthusiast seeking to expand your SDR workflow, this article provides the technical foundation needed to configure and operate an SDR-based scanning system effectively.
Getting Started
Frequency scanning is a versatile technique used to explore and analyze activity across the radio frequency (RF) spectrum. It involves systematically tuning a receiver across a predefined range of frequencies in order to detect active transmissions. These signals may carry voice communications, digital data, telemetry, or other forms of information. By continuously sweeping through frequency ranges and identifying signal activity, frequency scanning enables users to monitor and study a wide variety of radio services operating within the electromagnetic spectrum.
Antenna Considerations
A critical component of any effective scanning setup is the antenna system. For general-purpose scanning and wide spectrum coverage, a wideband omnidirectional antenna is strongly recommended. One of the most popular choices is the discone antenna, which is specifically designed to provide extremely broad frequency coverage with relatively consistent performance across multiple bands.
The primary advantage of a discone antenna is its ability to receive signals over a large frequency range without the need for retuning or switching between multiple antennas. Additionally, its omnidirectional radiation pattern allows it to receive signals from all directions simultaneously, making it well suited for monitoring diverse services such as public safety communications, aviation traffic, and amateur radio transmissions.
SDR Hardware Options
On the hardware side, an RTL-SDR USB dongle provides an inexpensive and highly accessible entry point into the world of software defined radio. Despite its low cost, the RTL-SDR is capable of covering a substantial portion of the RF spectrum and is supported by a large ecosystem of software tools and plugins.
For users seeking improved performance, higher-end SDR platforms such as the Airspy R2 or HackRF offer significant advantages. These devices provide greater instantaneous bandwidth, higher sampling rates, and improved dynamic range, allowing users to observe and analyze wider segments of the spectrum simultaneously. This expanded capability is particularly valuable when investigating complex digital modulation schemes, monitoring wideband signals, or performing more advanced RF analysis.
Installing Frequency Scanner Plugin
To simplify the installation process of all required software components in one go, you can opt for the SDRSharp Community Bundle, available for download from the SDR Chile website. Once downloaded, run the installer by double-clicking it, and then follow the on-screen instructions to choose your preferred installation location.
After the installation is finished, launch SDRSharp by clicking on its icon. Within the application, access the plug-ins by selecting the dropdown menu at the upper left corner. From there, navigate to the “Plug-ins” tab, and click on “Frequency Scanner Entry.” This action will open the Frequency Scanner plugin as a new tab window at your convenience.
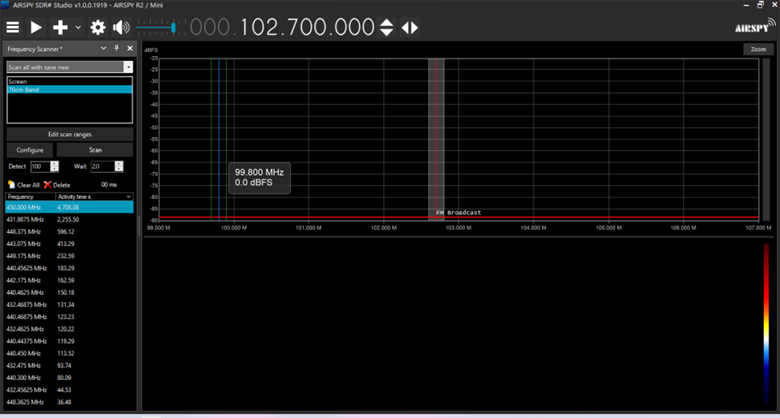
Understanding the Frequency Scanner Interface
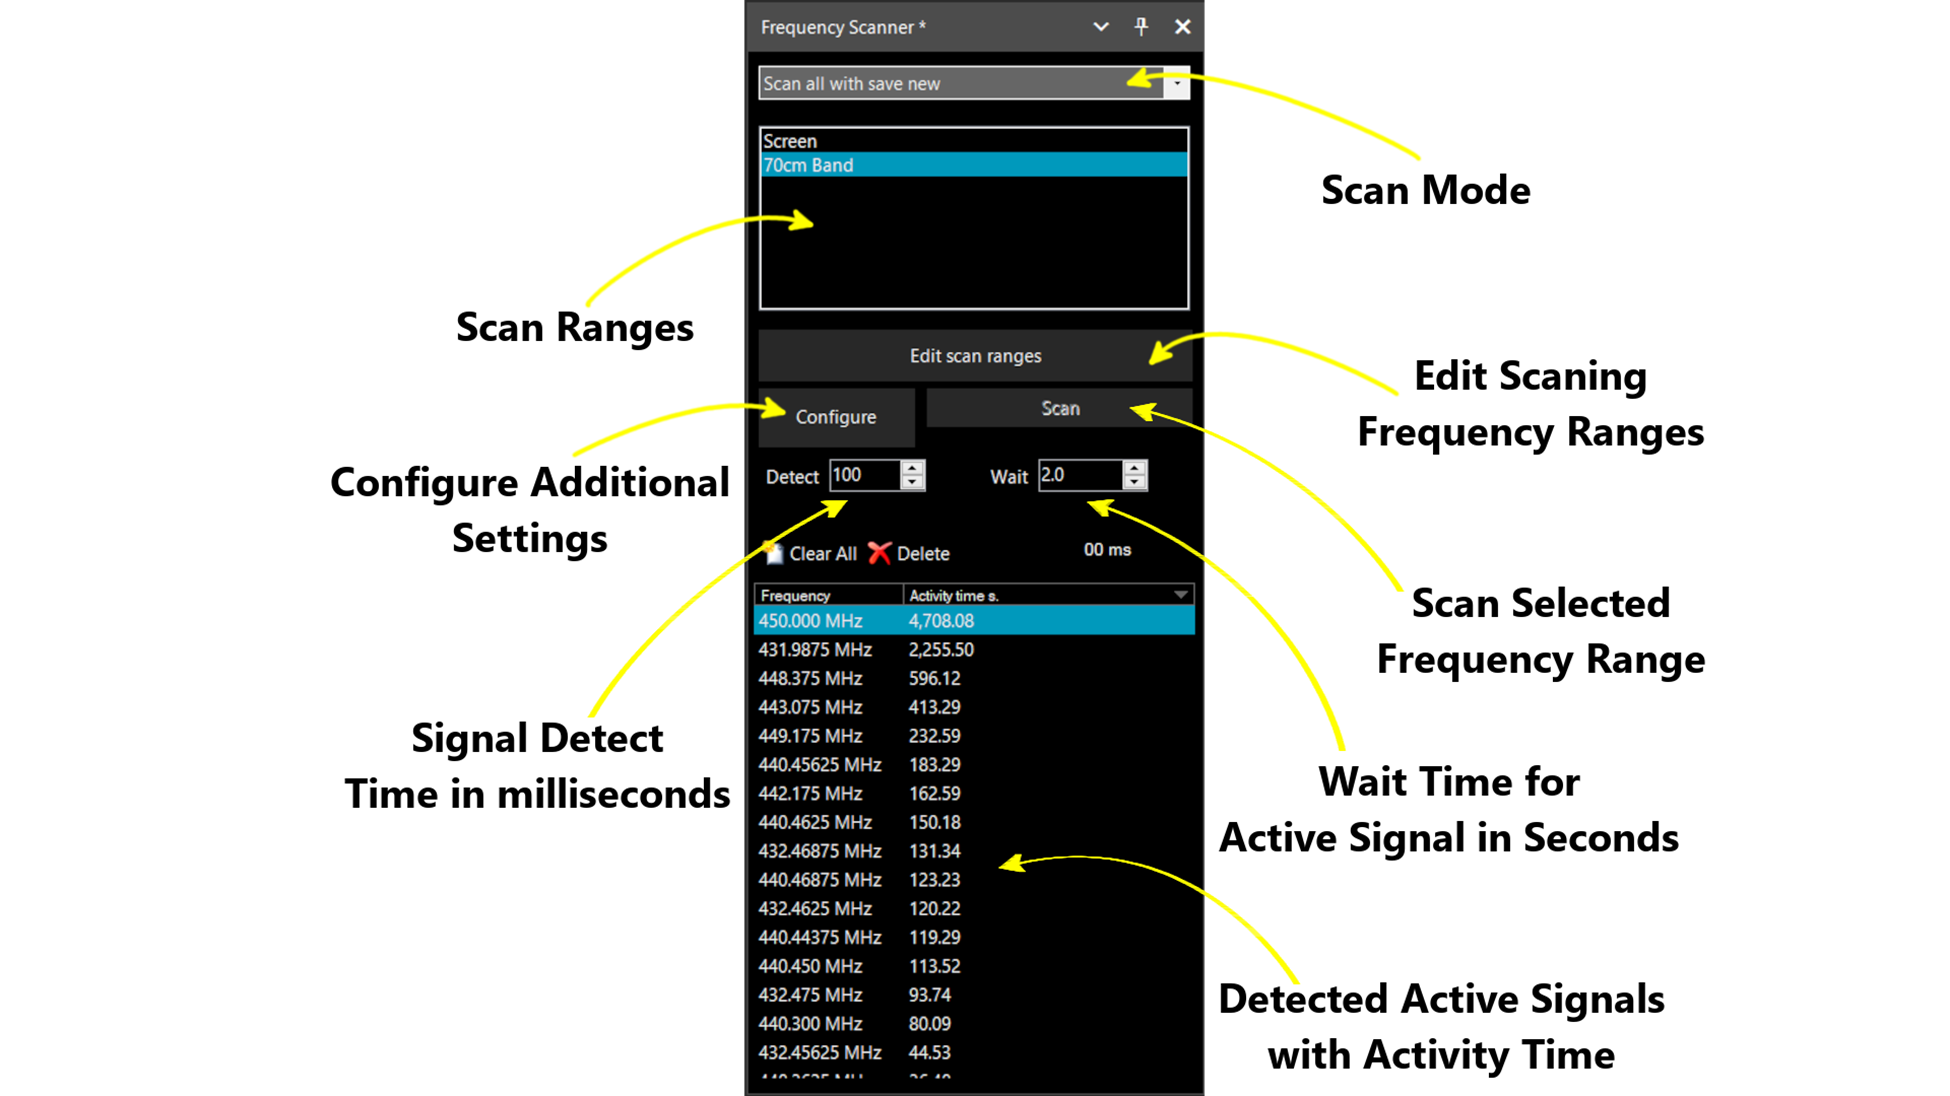
Scanning Modes
At the top of the plug-in window, you can choose the “Scanning Mode” depending on your specific use case. The Frequency Scanner Plug-in offers various scan modes, allowing you to tailor your scanning experience:
| Mode | Description |
|---|---|
| Scan Only Memorized | This mode exclusively scans frequencies stored in your Frequency Manager database. It excludes any new or unidentified signals. |
| Scan Only New | This mode ignores memorized frequencies and scans only for new, unidentified signals. |
| Scan All with Save New | In this mode, the scanner scans all frequencies but saves new, unidentified ones to your Frequency Manager. |
| Scan All without Save New | Similar to the previous mode, this scans all frequencies but doesn’t save unidentified signals. |
| Scan Only Enabled in Manager | This mode scans only the frequencies that are enabled in your Frequency Manager. |
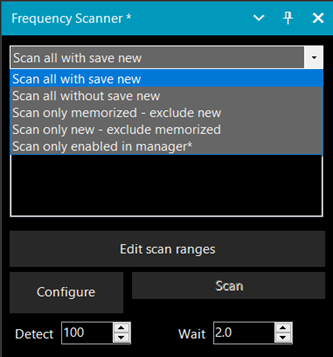
Setting Up Scan Ranges
Next, you can see the “Scan Ranges” tab, you can maintain multiple scanning ranges and switch between them whenever you want. To edit or create a new scanning range, click on the “Edit Scan Ranges” button and it will open up a separate window.
Be sure to input the correct values into the fields to define a scan range entry. Any incorrect entries will be highlighted in red, and you won’t be able to move on from the field until it’s corrected. All values should be specified in Hz, except for “Name,” “Detector,” and “Group”:
- “Name” — The label for the scan range, which will be displayed in the SDR# side panel.
- “Start” — Indicates the starting point for scanning.
- “End” — Specifies where the scanning should stop.
- “Detector” — Specifies modulation (AM, NFM, WFM, LSB, USB, DSB, RAW, CW)
- “Bandwidth” — Denotes the filter channel bandwidth that SDRSharp should use for the frequency range (if the bandwidth is greater than the step size, the step size value will be used instead.) The minimum value for bandwidth is 5000 Hz (5 kHz).
- “Step size” — Represents the spacing between each channel assigned in a scanned frequency range. The minimum value for the step size is 3125 Hz (3.125 kHz).
- “Group” — Used to filter the frequencies from the Frequency Manager for scanning. This functionality works with the scan mode “Scan only memorized - exclude new” to filter groups during scanning. Leaving this field blank will allow the scanner to detect all frequencies in all groups. Filling in this field will restrict the scanner to only display frequencies that match the specified group(s).
> Note: You won’t be able to click “OK” until all fields contain valid entries. To delete an entry, highlight the row and click ‘Delete row,’ and please note that there will be no confirmation for this action. If you wish to exit without saving any changes, click “Cancel.”
Configuration Settings
Subsequently, locate the “Configure” button, and upon clicking it, a new window will appear, encompassing all the configuration choices for the frequency scanner plugin. While most of these options are self-explanatory, I won’t delve into each one in this article, as it falls outside the article’s intended focus. Below, I’ll highlight the key and crucial settings you should be aware of.
Scanner Tab
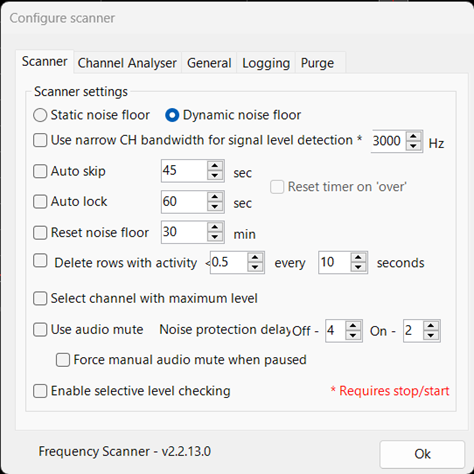
Frequency Scanner utilizes two modes to identify active signals, each with its own advantages and drawbacks:
Static Noise Floor
- Utilizes peak level values for scanning, but this approach may occasionally pause on random noise.
- It can be combined with the ‘Channel bandwidth for signal level detection’ option to enhance signal selectivity.
Dynamic Noise Floor
- Relies on signal-to-noise ratio level values for scanning.
- Note: When the scanner is initially started, reset, or modified, it requires one pass through all ranges to establish the baseline noise floor.
- Note: In most cases, it’s recommended to use this mode to identify signals.
Other Scanner Settings
| Setting | Description |
|---|---|
| Auto Skip | Automatically skips active transmissions and continues scanning if a signal remains active for more than the specified time. Useful for automatically skipping long transmissions and scanning for more signals in the meantime. |
| Auto Lock | Automatically locks out the currently active frequency and resumes scanning if a signal remains active for more than the specified time. Useful to filter out constantly active beacons, spurs, or digital carriers. |
| Reset Noise Floor | Periodically resets the noise floor reference level values at specified intervals. Useful to detect signals if you live in a noisy neighborhood. |
| Use Audio Mute | Mutes audio when the scanner starts. Unmutes audio when the scanner stops or pauses on an active frequency. Mutes audio when the scanner continues scanning. It is recommended to enable this option. |
Channel Analyser Tab
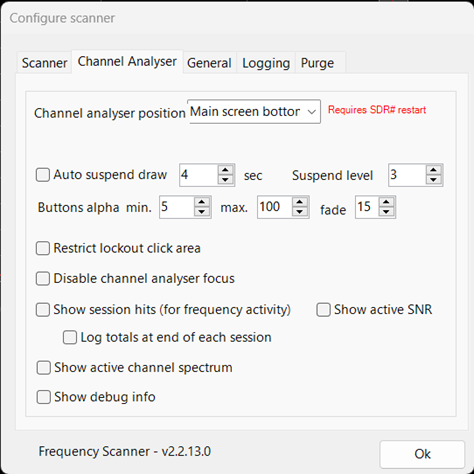
| Setting | Description |
|---|---|
| Channel Analyzer Position | Allows you to specify the position of the channel analyzer within the SDRSharp. |
| Auto suspend draw & suspend level | Stops the drawing of any channel analyzer activity when not needed after the interval specified. The suspend level determines what will still be shown/updated in the channel analyzer when suspended. Enabling this option can save CPU usage. |
| Show Session Hits | Appends hit count to the frequency label line displayed in the channel analyzer for the active frequencies. Clicking ‘Stop scan’ clears these values and can be logged with the “Log Totals at the End of Each Session” option. Recommended if you wish to observe and record the frequency of occurrences when a specific signal remains active during a scanning session. |
| Show Active SNR | Adds the SNR value to the end of the label for the active frequency in the channel analyzer. Recommended if you wish to view and log SNR values for active signals. |
| Log Totals at the End of Each Session | At the conclusion of a session, if any frequencies have a hit count greater than 0, they will be recorded in a log file. The log file contains the start and end date/times of the session, scan mode, ranges used in the session, scanned frequency range name, hit counts, and SNR values. Useful to log signal activities for future use. |
| Show Active Channel Spectrum | Displays a small spectrum view in the channel analyzer next to the active frequency marker. The spectrum size matches the channel bandwidth used to detect a signal. Recommended to view more info about the scanning process. |
| Show Debug Info | Reveals additional scanner information such as number of segments used to scan all defined scan ranges, time taken to scan all segments, scan speed, and activity time. Recommended to view more info about the scanning process. |
General Tab
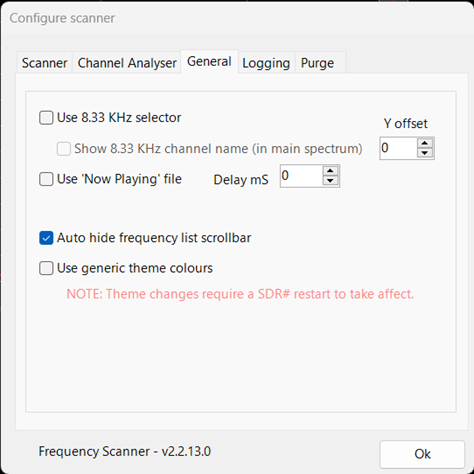
| Setting | Description |
|---|---|
| Use 8.33 Khz selector | Enable this option if you’re scanning airband to help correctly tune the VFO to 8.33 Khz frequency allocation. |
| Display 8.33 KHz Channel Name | Associates the VFO frequency with an 8.33 kHz channel name. This feature functions exclusively when scanning the airband (118-137 MHz). Be aware that other plugins may utilize the same space to display information and use “Y Offset” to adjust the position. |
> Note: All remaining configuration options are straightforward and should only be adjusted based on specific, unique needs. For more detailed information, please consult the user manual, which is accessible in the SDR# folder at the following location: SDRSharp\\Plugins\\FrequencyScanner\\Frequency_scanner_plug-in.pdf.
Main Controls
Moving on, we have the “Scan” button, which, when clicked, initiates or halts the scanning process based on the predefined scan ranges.
Next in line is the “Detect” button, which reduces the scan speed to enhance the detection of an active signal. The value specified serves as a delay, allowing the receiver to stabilize and ensuring that active signals are not missed during detection.
Following that, we have the “Wait” button, which determines the duration of the delay after a transmission has concluded before the scan resumes.
Channel Analyser Pane
The channel analyzer serves as a visual representation of all the predefined frequency ranges that are currently under scanning. Here are its key functions:
- It provides real-time updates on the Signal-to-Noise Ratio (SNR) levels of the frequencies within the scanning range during each scan cycle.
- The lockout status of each frequency within the scanning range is visibly indicated by specific colors.
- It displays detailed information such as Group and Name, hit count, SNR, and a spectrum view for the currently active frequency.
- The Group and Name of the frequency, along with its hit count, are displayed at the location where the mouse cursor is positioned.
- Optionally, it can display a compact spectrum view of the active channel’s bandwidth.
- Users have the choice to optionally view debugging information.
- The channel analyzer panel is also where you can configure and set permanent or temporary lockout states for individual frequencies.
Lockout Controls
The Lockout and Remove Lockout buttons specifically apply to the frequency that is currently active or has been paused. They provide a means to stop the scanning process for particular frequencies or a range of frequencies.
- These buttons are automatically deactivated while the scanning process is ongoing.
- The user can switch between permanent and temporary lockout modes by right-clicking on either button.
- The button’s background color serves as an indicator of the chosen lockout mode:
- Permanent lockout is represented by Grey.
- Temporary lockout is denoted by Red.
Modifying Lockout Status
To modify the lockout status of a frequency:
- Users can left-click on either the Lockout or Remove Lockout buttons corresponding to the active or playing frequency.
- Alternatively, they can directly click on the channel analyzer panel itself, away from other buttons, at the position where the frequency of interest resides. Zoom functionality can be employed if necessary to pinpoint the frequency more accurately.
> Note: When it comes to altering the lockout state for a range of frequencies, it’s important to exercise caution. Please take note that the clickable area on the screen depends on the ‘Restrict lockout click area’ option.
Locking Out a Range of Frequencies
To lock out or remove lockouts from a range of frequencies simultaneously:
- Users should initiate a left-click and hold action, then drag to select the desired range of frequencies.
- Upon releasing the left mouse button, the selected range of frequencies will be affected.
- When left-clicking inside the marked range, it will lock out all frequencies within that range.
- Conversely, right-clicking inside the marked range will remove lockouts from all frequencies within the specified range.
Zooming
Zooming within the Channel Analyzer panel can be accomplished using the mouse scroll wheel. This action centers the frequency within the Channel Analyzer and functions in one of two ways, depending on the selected Zoom Type:
Z1 Mode: This mode zooms in on the last active frequency. To activate Z1, place the mouse cursor anywhere in the Channel Analyzer panel and utilize the scroll wheel (up or down). Alternatively, you can perform a quick zoom by clicking the scroll wheel (center button). Please note that you must return to a non-zoomed view before you can begin zooming in on a new frequency.
Z2 Mode: In this mode, zooming is directed to the frequency at the position of the mouse cursor. To activate Z2, place the mouse cursor precisely at the frequency you intend to zoom in on, and then use the scroll wheel (up or down) or click the scroll wheel (center button) for a quick zoom.
Configuring Trigger and Hysteresis Levels
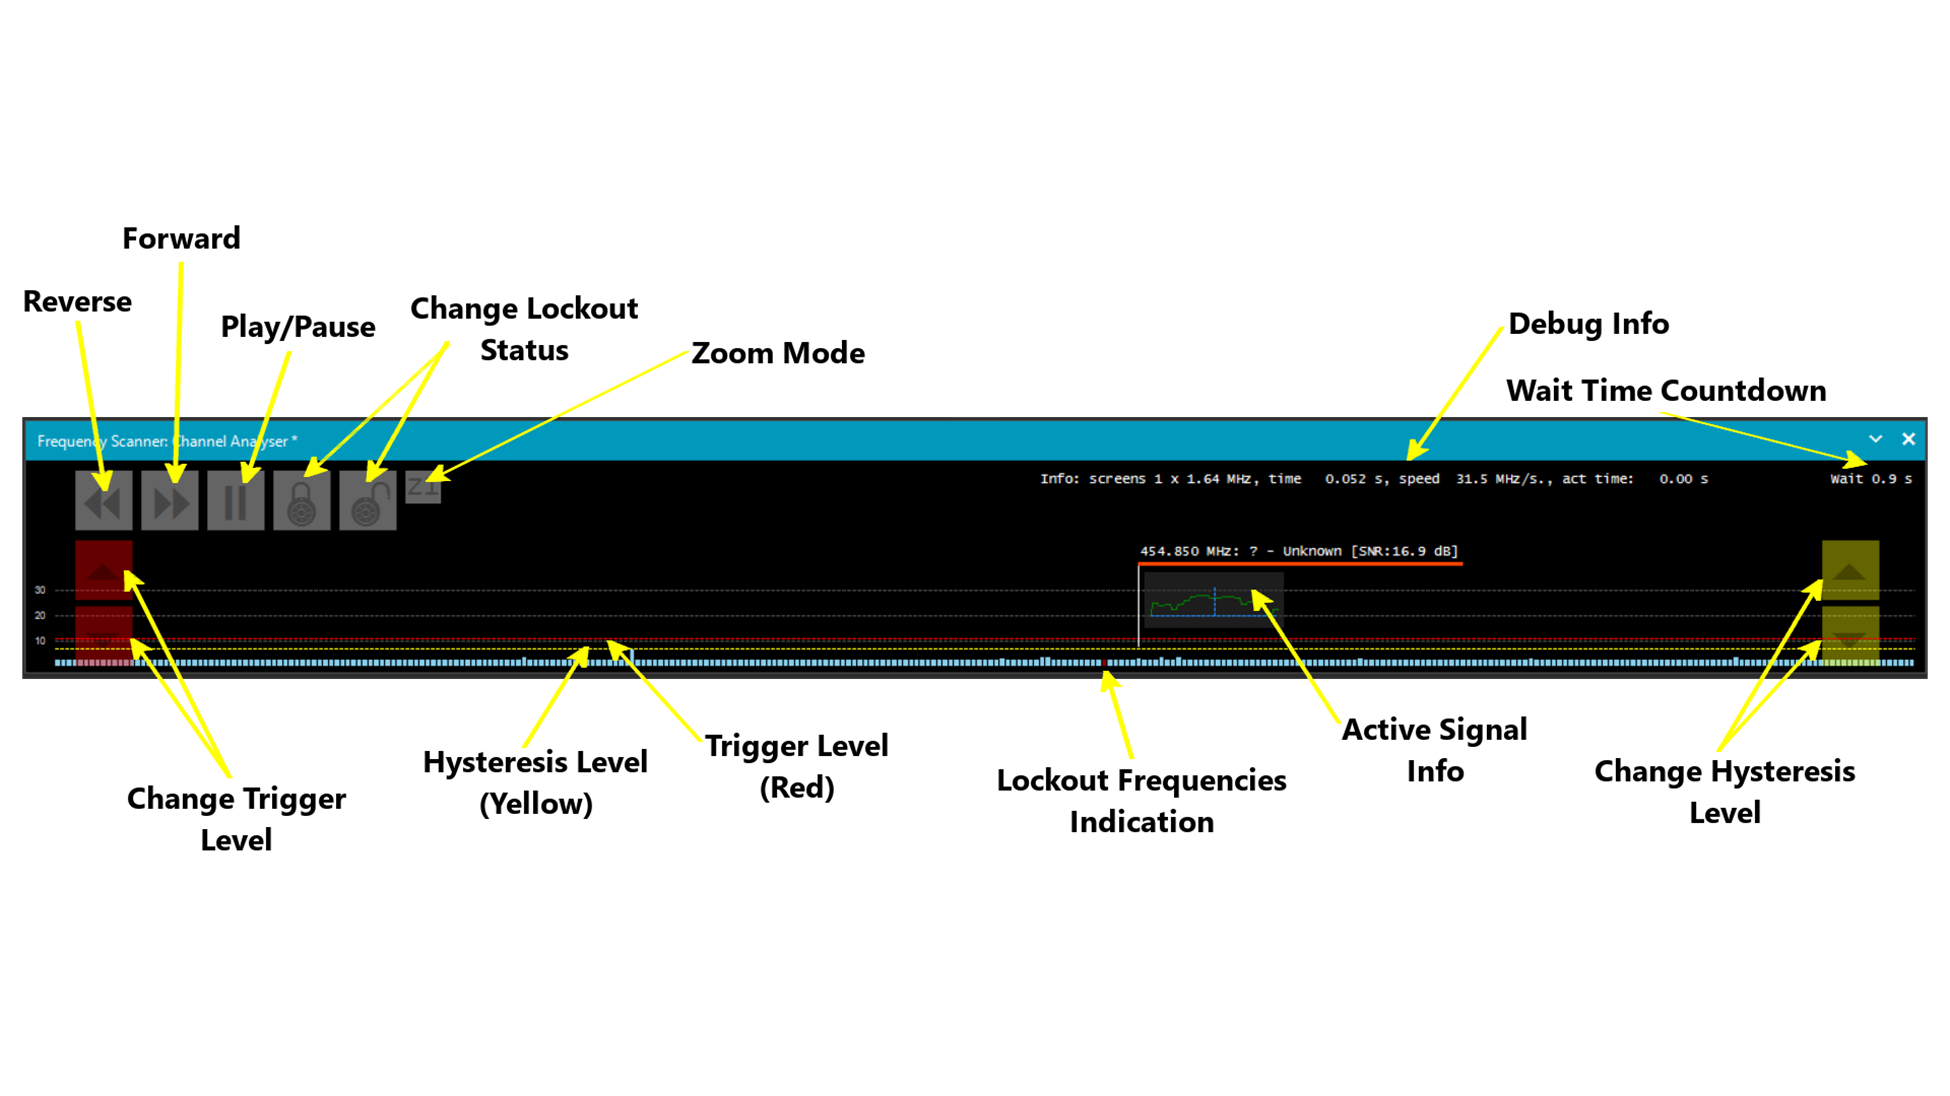
These two parameters govern when the scanner suspends scanning and when it resumes its scanning operation. The red button adjusts the detection trigger level, while the yellow button adjusts the hysteresis level.
Detection Trigger Level (Red Horizontal Line)
When a received signal surpasses the red line, scanning halts, and the scanner transitions to listening mode.
Hysteresis Level (Yellow Horizontal Line)
Following the occurrence described above, once a received signal drops below the yellow line, a countdown begins for a waiting (delay) period.
- When this countdown expires, scanning resumes.
- Alternatively, if the signal exceeds the red line again during the waiting (delay) period, the waiting counter resets and the scanner remains on the current frequency.
- Once a signal has triggered the scanner to pause by surpassing the red line, it can remain paused as long as it remains above the yellow line, avoiding the waiting (delay) state, or it can continue scanning if it falls below the yellow line.
Troubleshooting
Common Issues and Solutions
| Issue | Possible Cause | Solution |
|---|---|---|
| Scanner stops on noise/static | Static Noise Floor mode selected; trigger level too low | Switch to Dynamic Noise Floor mode, or raise the detection trigger level (red line) |
| Missing active signals | Scan speed too fast; step size too large | Reduce scan speed using the “Detect” button, or decrease step size in scan range settings |
| Scanner won’t start | Invalid scan range values; missing required fields | Check that all scan range fields are filled correctly (red highlights indicate errors) |
| No audio output | Audio Mute not configured properly | Enable “Use Audio Mute” in Scanner tab configuration |
| Frequencies not being saved | Wrong scan mode selected | Ensure you’re using “Scan All with Save New” mode to capture new frequencies |
| High CPU usage | Channel analyzer drawing continuously | Enable “Auto suspend draw” in Channel Analyser tab settings |
| Noise floor constantly changing | Environment has variable interference | Enable “Reset Noise Floor” with appropriate interval timing |
| Can’t lock out frequencies | Scanner is currently running | Stop the scan first before attempting to lock out frequencies |
| 8.33 kHz channels not displaying correctly | 8.33 kHz selector not enabled | Enable “Use 8.33 Khz selector” in General tab when scanning airband |
Tips for Optimal Scanning
-
Start with a known active frequency — Test your setup on a frequency you know is active (like a local FM broadcast station) to verify everything is working.
-
Use appropriate bandwidth settings — Match your bandwidth to the signal type: narrower for NFM/AM voice, wider for WFM broadcasts.
-
Monitor the noise floor — If you live in an RF-noisy environment, use Dynamic Noise Floor mode and enable periodic reset.
-
Save your scan ranges — Create different scan range profiles for different bands of interest (Airband, Marine, Amateur, etc.).
-
Check your antenna — Poor reception is often an antenna issue, not an SDR issue. Ensure your discone or wideband antenna is properly installed and has good line of sight.
-
Log your sessions — Enable “Log Totals at the End of Each Session” to build a database of active frequencies in your area.
Conclusion
The Frequency Scanner plugin transforms SDRSharp from a simple receiver into a powerful scanning platform capable of rivaling dedicated hardware scanners. By understanding the various scanning modes, properly configuring your scan ranges, and utilizing the channel analyzer effectively, you can efficiently monitor large portions of the spectrum with minimal effort.
Whether you’re hunting for new signals, monitoring public safety communications, or simply exploring the RF landscape, this setup provides an incredibly flexible and cost-effective solution. The ability to log hits, analyze SNR values, and customize lockout behaviors makes it an invaluable tool for any serious radio enthusiast.
Remember: the spectrum is always changing. What you find today might be gone tomorrow, and new signals appear constantly. Happy scanning!
Questions or comments? Reach out via QRZ or check out more articles on Noise Floor Nomad.
Signal Reports