How to Use Your SDR as a Scanner
From static to signals — mastering the art of automated frequency scanning
The Scanner’s Mindset
In our increasingly interconnected world, the airwaves are abuzz with a symphony of signals — from broadcast radio stations and emergency services to aviation communications and those mysterious clandestine transmissions that keep us up at night. This invisible realm of electromagnetic waves remains a mystery to the untrained ear, a cacophony of static and signals.
However, for those armed with the right tools and knowledge, it presents a captivating vista into radio communications.
In this guide, we’ll transform your SDR into a comprehensive frequency scanner using SDRSharp and the Frequency Scanner Plugin. Whether you’re monitoring public safety, hunting for satellite downlinks, or just exploring the spectrum, automated scanning changes everything.
Hardware Considerations
📡 Antenna Selection
For optimal scanning results, your antenna choice is critical: ### The Discone Advantage A **wideband omni-directional discone antenna** is the scanner's best friend. Unlike directional antennas that require constant adjustment, a discone captures signals from **25-1300 MHz** (or more) across all directions. **Why it matters for scanning:** - No tuning required as you hop bands - 360° coverage means you won't miss that distant transmission - Wide impedance matching across VHF/UHF **Alternatives:** - **Diamond D130J**: Premium option, excellent build quality - **Homebrew Discone**: Copper wire + aluminum cone, ~$20 in parts - **RTL-SDR Dipole Kit**: Good starter, but limited VHF performance🔌 SDR Hardware Tiers
| Tier | Device | Sample Rate | Best For | Price Range | |------|--------|-------------|----------|-------------| | **Entry** | RTL-SDR Blog V4 | 2.56 MSPS | General scanning, beginners | $25-35 | | **Mid** | Airspy Mini | 6 MSPS | Bandwidth-intensive modes | $100-120 | | **Pro** | Airspy R2 | 10 MSPS | Wideband monitoring, precision | $170-190 | | **HackRF** | HackRF One | 20 MSPS | Full-duplex, transmit capability | $300+ | **My Recommendation:** Start with the RTL-SDR Blog V4. The improved thermal design and TCXO make it surprisingly capable for scanner duty. Upgrade to Airspy R2 when you need that 10 MHz bandwidth for trunked systems.Installation
Step 1: SDRSharp Community Bundle
Rather than wrestling with individual plugins, grab the SDRSharp Community Bundle from SDR Chile. This includes:
- SDRSharp base application
- Frequency Scanner Plugin (pre-configured)
- Community plugin pack
- RTL-SDR drivers
1. Download SDRSharp_Community_Bundle_x86.exe
2. Extract to C:\SDRSharp (avoid Program Files!)
3. Run install-rtlsdr.bat
4. Plug in your dongle
5. Launch SDRSharp.dotnet8.exe
Step 2: Enable the Plugin
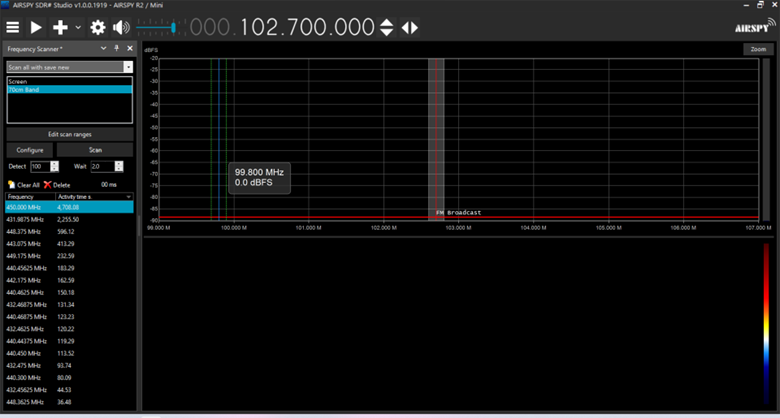 Figure 1: Accessing the Frequency Scanner via the Plugins menu
- Click the hamburger menu (☰) top-left
- Select “Frequency Scanner Entry”
- The plugin appears as a new tab/panel
Interface Deep Dive
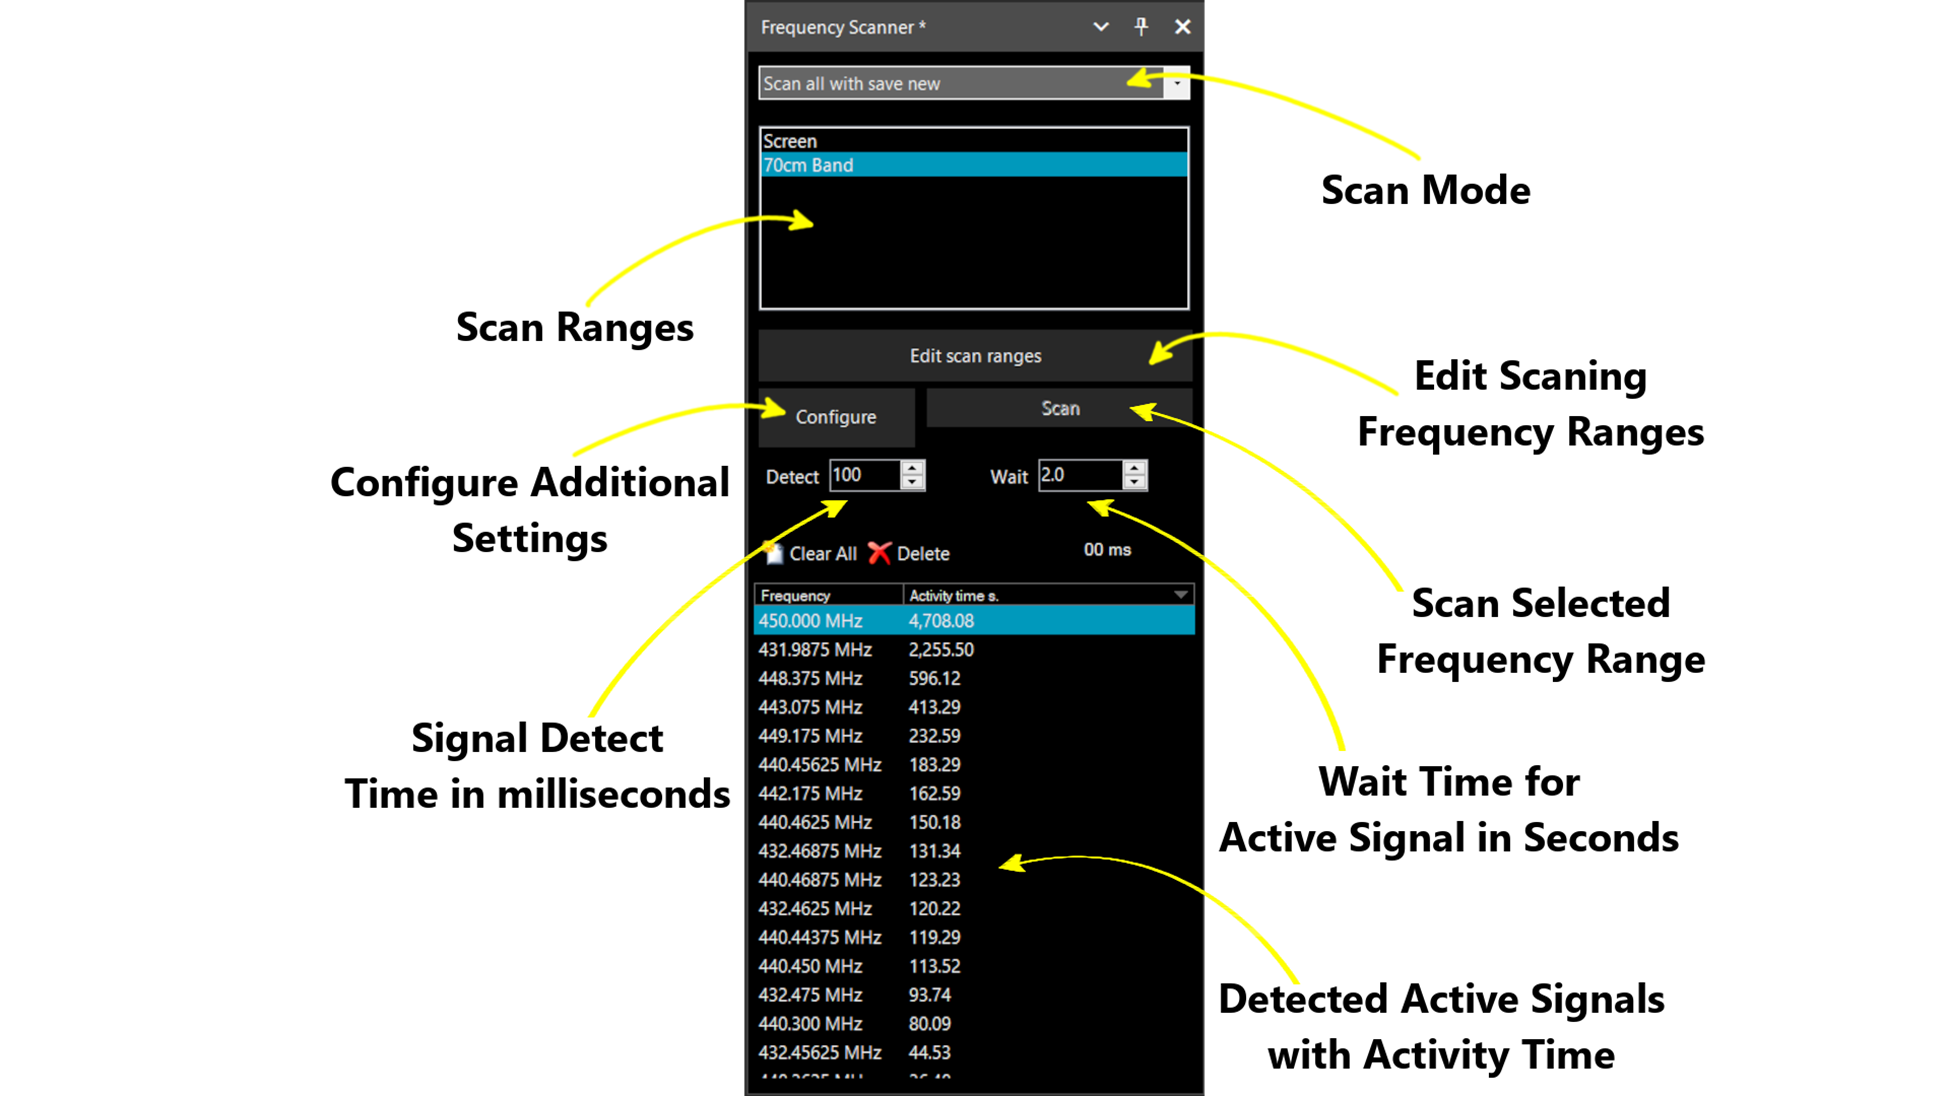 Figure 2: Complete Frequency Scanner interface with Channel Analyzer visible
Understanding the Layout
The interface breaks down into four functional zones:
🎯 Zone 1: Mode Control
Scanning mode selector and range management
📊 Zone 2: Channel Analyzer
Visual spectrum representation of scan ranges
⚙️ Zone 3: Configuration
Detection thresholds, audio, logging settings
▶️ Zone 4: Transport
Start/Stop, Detect, Wait controls
Scanning Modes Explained
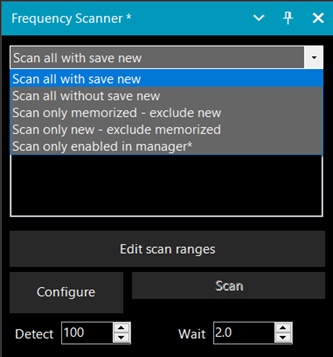 Figure 3: The five scanning modes available
Choose your strategy based on what you’re hunting:
| Mode | Use Case | Behavior |
|---|---|---|
| Scan Only Memorized | Monitoring known frequencies | Ignores new signals, focuses on your database |
| Scan Only New | Spectrum discovery | Finds unidentified signals, ignores known ones |
| Scan All with Save | Logging & discovery | Scans everything, adds new finds to database |
| Scan All without Save | Temporary monitoring | Scans everything, no database changes |
| Scan Only Enabled | Curated monitoring | Only frequencies you’ve marked as active |
Pro Tip: Use “Scan Only New” during your initial spectrum survey of a new band. Switch to “Scan All with Save” for daily monitoring to build your local signal database.
Setting Up Scan Ranges
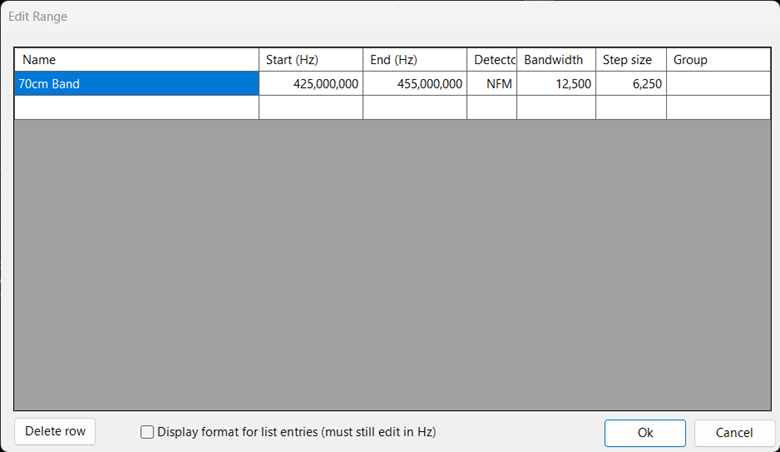 Figure 4: The Scan Range Editor dialog
Creating Your First Range
Click “Edit Scan Ranges” to open the editor. Here’s how to configure a typical aviation band scan:
⚠️ Validation: Invalid entries highlight in red. The OK button remains disabled until all fields are valid. Step size minimum is 3125 Hz; bandwidth minimum is 5000 Hz.
Advanced: Multiple Ranges
Create separate ranges for:
- Marine VHF: 156-174 MHz (NFM, 25 kHz steps)
- 2m Amateur: 144-148 MHz (NFM, 12.5 kHz steps)
- Pager Bands: 152-158 MHz (POCSAG/FLEX detection)
- Military UHF: 225-380 MHz (AM/NFM mixed)
Configuration Mastery
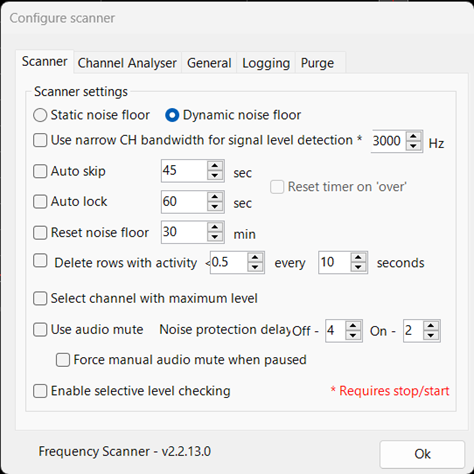 Figure 5: Scanner tab with detection settings
Detection Modes: The Critical Choice
Static Noise Floor
- Uses absolute signal strength (dBFS)
- ⚠️ Prone to pausing on noise spikes
- Good for: Quiet bands, strong signals only
Dynamic Noise Floor ⭐ Recommended
- Uses Signal-to-Noise Ratio (SNR)
- Adapts to changing band conditions
- Requires one full scan pass to establish baseline
- Good for: Noisy environments, weak signal detection
Essential Settings
Auto Skip vs Auto Lock
**Auto Skip**: "This transmission is too long, move on" - Set to 30-60 seconds for voice communications - Prevents getting stuck on control channels or data bursts **Auto Lock**: "This frequency is always active, ignore it" - Set to 2-5 minutes for persistent carriers - Filters out: Birdies, digital beacons, interferenceAudio Management
**Use Audio Mute**: ✅ **Always Enable This** - Mutes during scanning (no noise fatigue) - Unmutes when signal detected - Re-mutes when scanning resumes **Reset Noise Floor**: Enable if you have: - Variable local interference - Changing propagation conditions - Neighborhood noise sources (LED lights, power supplies)Channel Analyzer Visualization
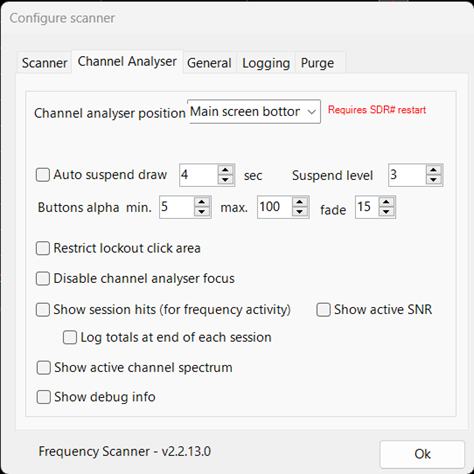 Figure 6: Channel Analyzer showing active signals and lockout status
The Channel Analyzer is your spectrum cockpit. Understanding the visual language:
Color Coding
Interactive Features
Zooming:
- Z1 Mode: Scroll wheel zooms to last active frequency
- Z2 Mode: Scroll wheel zooms to cursor position (more intuitive)
- Reset: Click center mouse button to return to full view
Lockout Management:
- Click a frequency: Toggle lockout
- Click-Drag range: Select multiple frequencies
- Left-click in selection: Lock all selected
- Right-click in selection: Unlock all selected
Trigger and Hysteresis
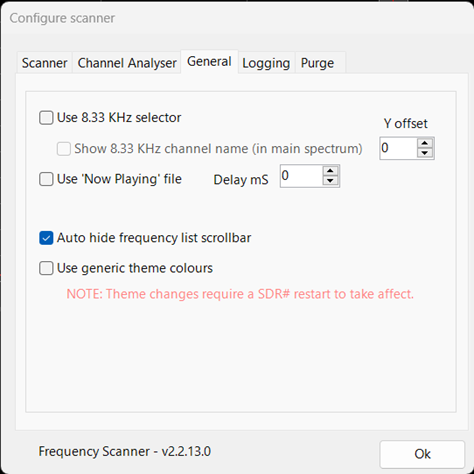 Figure 7: Red (trigger) and Yellow (hysteresis) threshold lines
These two lines control the scanner’s behavior:
Detection Trigger (Red Line)
When signal strength crosses above this line:
- Scanning pauses
- Audio unmutes
- Signal analysis begins
Hysteresis Level (Yellow Line)
Once triggered, signal must drop below this line to begin “Wait” countdown:
- Prevents rapid stop/start on fluttery signals
- Creates stable hold behavior
- If signal re-crosses red line during wait, timer resets
Setting Guidelines:
- Quiet band: Trigger at -50 dB, Hysteresis at -60 dB
- Noisy band: Trigger at -40 dB, Hysteresis at -50 dB
- Digital modes: Tighter gap (5-10 dB between lines)
- Voice modes: Wider gap (10-15 dB between lines)
Practical Scanning Profiles
Profile 1: Aviation Monitoring
Range: 118-137 MHz
Mode: AM
Step: 8.33 kHz (enable 8.33 kHz selector in General tab)
Bandwidth: 10 kHz
Detector: Dynamic Noise Floor
Auto Skip: 45 seconds
What you’ll hear:
- ATC clearances
- Approach/Departure
- ATIS broadcasts
- ACARS data bursts (sound like fax machines)
Profile 2: Public Safety Trunking
Range: 851-869 MHz (US) or 380-400 MHz (EU TETRA)
Mode: NFM
Step: 12.5 kHz
Bandwidth: 12.5 kHz
Detector: Dynamic Noise Floor
Auto Skip: 15 seconds
Note: For trunked systems, you’ll need Unitrunker or similar for talkgroup following. The Frequency Scanner identifies active control channels.
Profile 3: Satellite Downlink Hunting
Range: 137-138 MHz (NOAA/Meteor) or 240-270 MHz (Military SATCOM)
Mode: NFM/WFM depending on satellite
Step: 5 kHz
Bandwidth: 15-40 kHz
Detector: Static Noise Floor (weak signals)
Auto Skip: Disabled (record everything)
Logging and Analysis
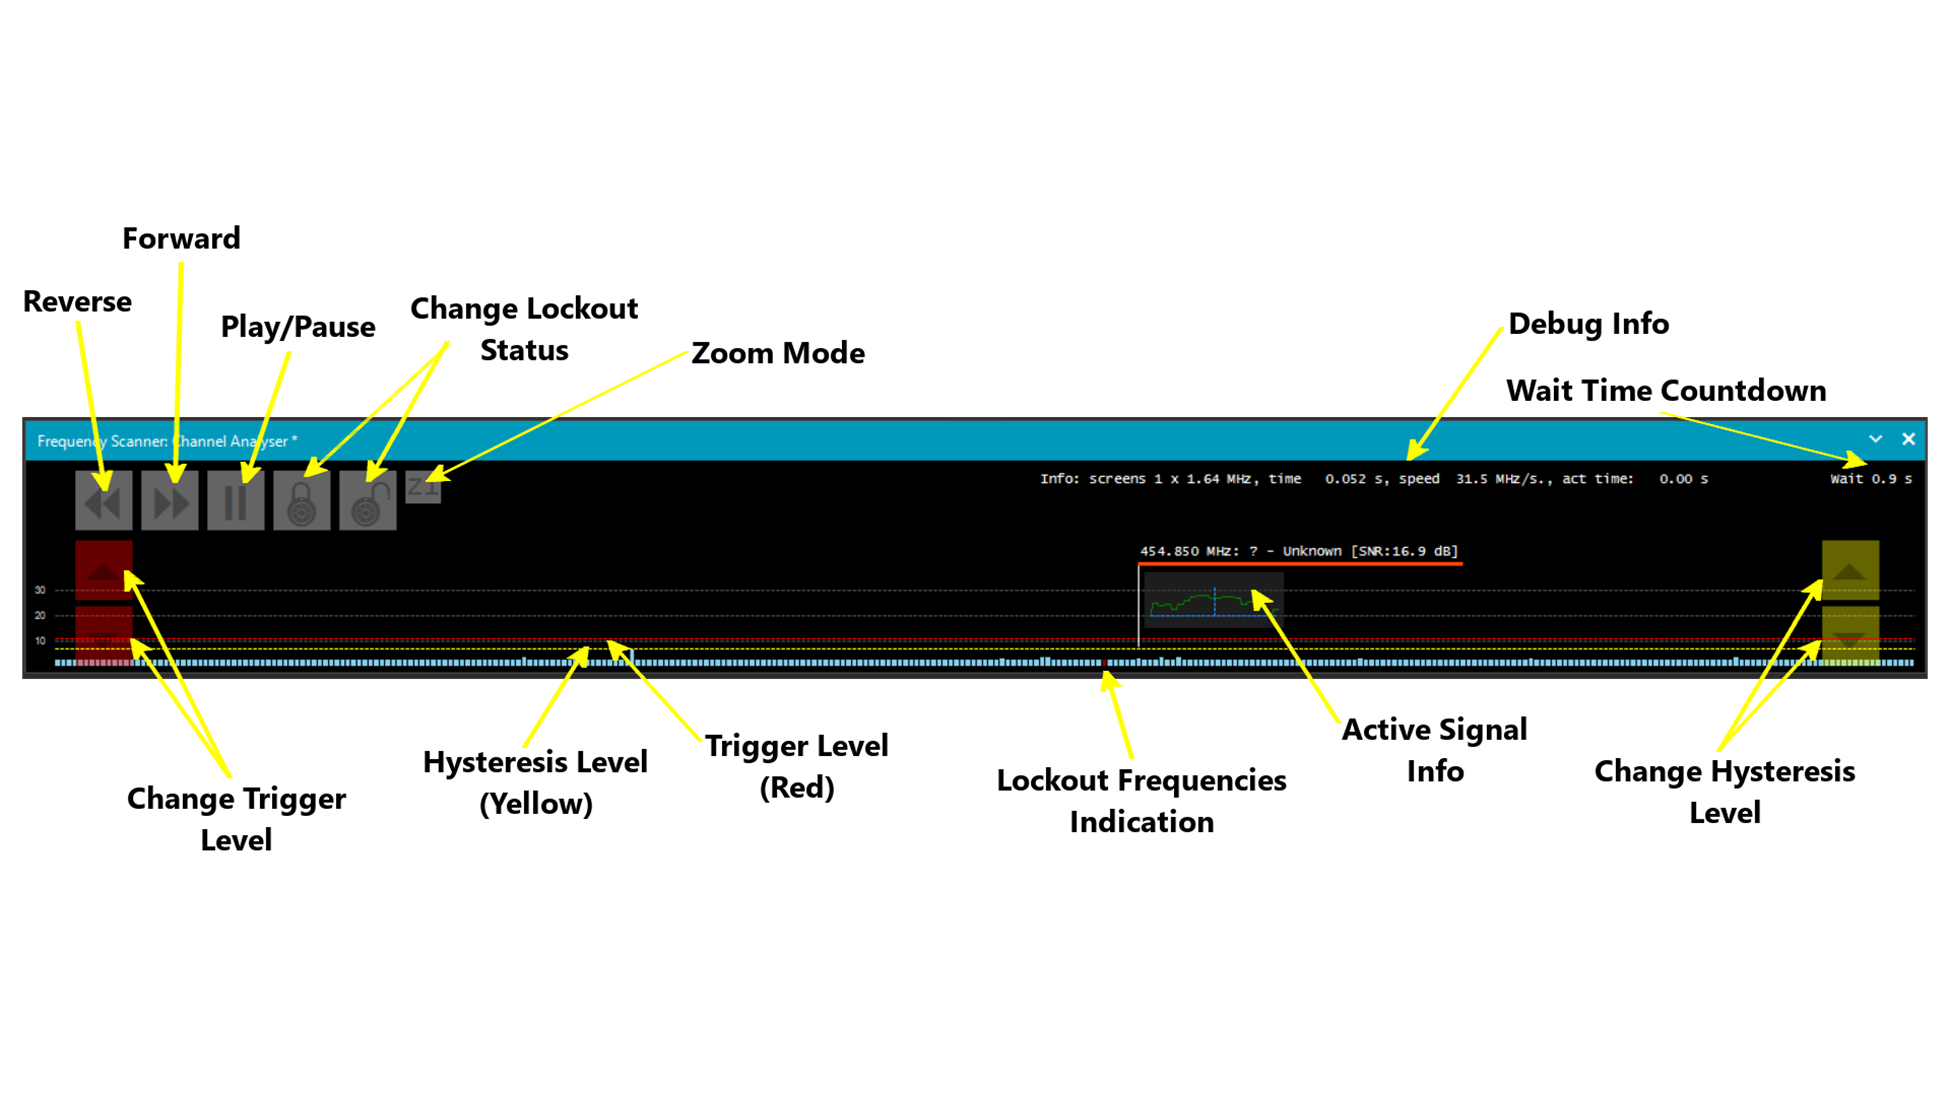 Figure 8: Session logging configuration
Enable “Log Totals at the End of Each Session” to generate CSV files containing:
- Session start/end timestamps
- Frequency and hit count
- SNR values at detection
- Scan mode and ranges used
Analysis workflow:
- Scan overnight with “Scan All with Save”
- Import CSV into Excel/Python
- Identify patterns: “146.520 MHz active at 02:00 daily”
- Add discovered frequencies to memorized list
Troubleshooting
Scanner pauses on noise/static
**Cause:** Static noise floor mode with threshold too low **Fix:** 1. Switch to Dynamic Noise Floor 2. Raise trigger level by 5-10 dB 3. Enable "Use Audio Mute" to confirm it's actually stoppingMissing weak signals
**Cause:** Bandwidth too narrow or step size too large **Fix:** 1. Reduce step size to 3.125 kHz minimum 2. Increase bandwidth to match signal width 3. Lower trigger level gradually 4. Check "Reset Noise Floor" interval isn't too aggressiveScanner stuck on one frequency
**Cause:** Auto Skip disabled or set too long **Fix:** 1. Enable Auto Skip (30s for voice, 10s for data) 2. Check if frequency is a control channel 3. Use Auto Lock instead to permanently ignoreChannel Analyzer not updating
**Cause:** "Auto Suspend Draw" enabled with short timeout **Fix:** 1. Go to Channel Analyser tab 2. Disable "Auto Suspend Draw" OR increase timeout 3. Check "Show Active Channel Spectrum" is enabledAdvanced Tips
Run "Scan Only New" for 24 hours on a wide range (e.g., 144-146 MHz). Then analyze the log to find the quietest frequency for your QRP operations.
Set a narrow bandwidth (5 kHz) and small step (3.125 kHz). Scan your problem band with "Show Debug Info" enabled. The "activity time" metric reveals interference duty cycles.
Combine Frequency Scanner with Orbitron. Set Auto Lock on persistent terrestrial signals, then scan the satellite band only during predicted passes.
Conclusion
The Frequency Scanner Plugin transforms SDRSharp from a manual tuning tool into an automated spectrum monitoring station. Whether you’re building a signal database, monitoring emergency services, or hunting for satellite downlinks, the key is understanding the relationship between:
- Detection modes (Static vs Dynamic)
- Thresholds (Trigger and Hysteresis)
- Time management (Auto Skip/Lock)
Start with conservative settings, observe behavior, then optimize for your specific environment. The best scanner configuration is the one that catches what you’re looking for while ignoring what you’re not.
In the noise, we find signals.